


In the previous post, delivery was moved closer to customers.
EU CD serving EU users.
US CD serving US users.
Publishing keeping both regions aligned.
Autoscale and health checks protecting each footprint independently.
Structurally, that’s a big improvement.
But the moment you introduce multiple regions, something else happens.
The platform becomes harder to manage and operate.
You now have two delivery environments behaving independently.
They scale independently.
They recover independently.
They may even perform differently under similar load. Without visibility, that complexity turns into uncertainty.
This is where observability stops being optional and becomes foundational.
Multi-region changes the questions you need to answer
In a single-region world, monitoring is simple. You watch request duration, failures, CPU, memory. If something spikes, there’s only one place to look.
In a multi-region world, everything becomes comparative.
Is EU actually faster for EU users?
Did the last deployment impact only one geography?
Are autoscale events happening more aggressively in one region?
Is one region consistently making slower dependency calls?
You’re no longer checking if the platform is up. You’re trying to understand how it behaves.
That’s the shift.
And Application Insights is what makes that shift manageable.
Instrument every CD region properly
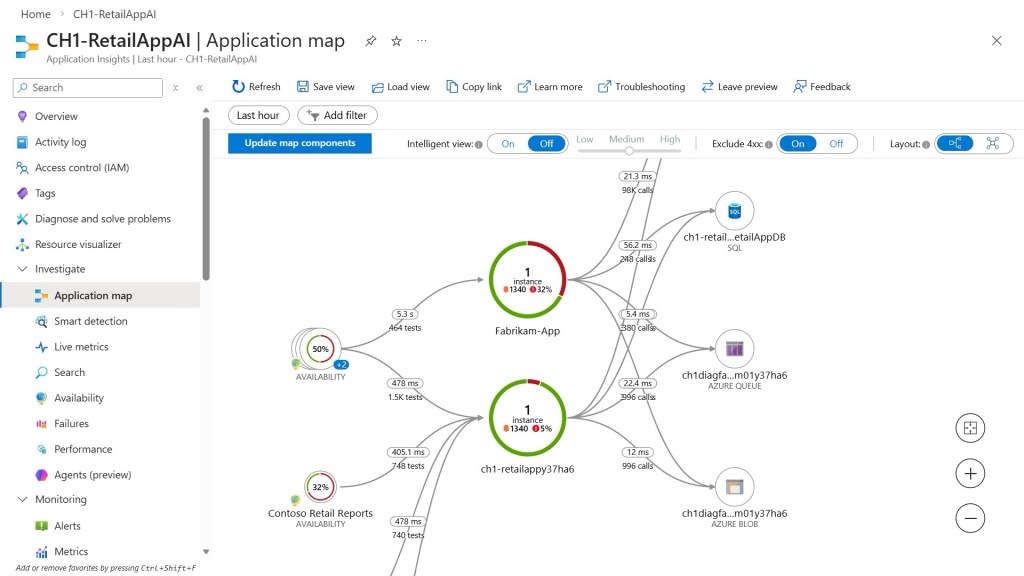
Each regional CD App Service should use a single Application Insights instance.
You need to capture request telemetry, dependency telemetry, exceptions, and instance-level behaviour. You want to see SQL calls, Redis latency, search calls, and how they differ by geography.
Once telemetry is flowing from both regions, the first thing you notice is that behaviour is never identical. Even when infrastructure is mirrored, load patterns differ. Network paths differ. User behaviour differs.
That insight alone is valuable. It removes assumptions and replaces them with evidence.
Autoscale becomes something you understand
Autoscale sounds reassuring on paper. In reality, it has timing. New instances take time to warm. Scale events don’t happen instantly. Minimum capacity decisions matter.
With Application Insights and Azure Monitor together, you start correlating scale events with request latency. You see when new instances join the pool. You see whether performance improves immediately or gradually.
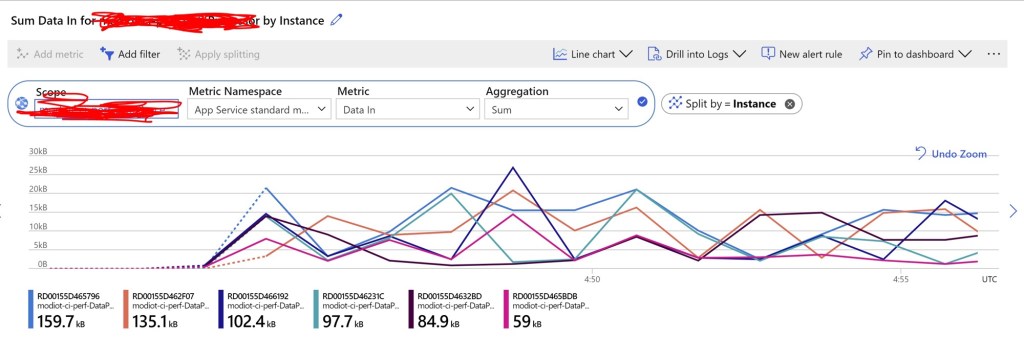
Sometimes autoscale hides a capacity planning problem. Sometimes it behaves perfectly.
That level of awareness is what turns infrastructure features into operational tools.
Health checks should not be invisible
In the previous post, App Service health checks were enabled to automatically remove unhealthy instances. That’s an important resilience improvement.
But automatic recovery shouldn’t be silent.
If instances are frequently being recycled, something upstream is causing pressure. Memory, CPU, dependency timeouts. Application Insights surfaces those patterns.
Instead of just knowing that the platform healed itself, you understand why it needed to.
Over time, that feedback loop improves the stability of the entire environment.
Availability tests give you the customer view
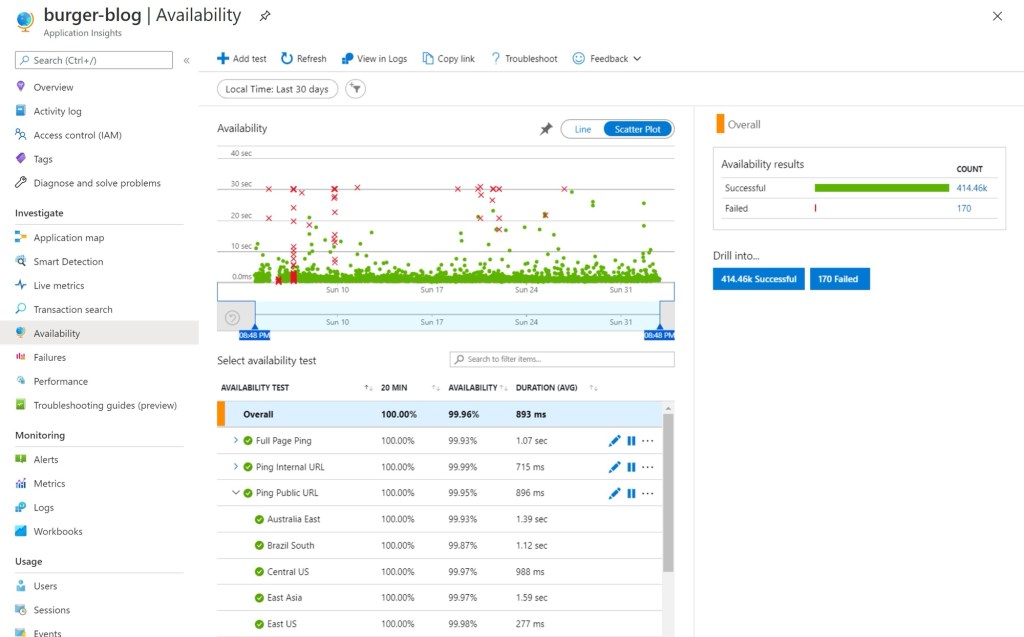
Infrastructure metrics tell you the platform is alive. Availability tests tell you how it feels.
Configuring synthetic tests against each regional endpoint gives you an external perspective. You can see uptime and response time from different geographic locations.
This is often where subtle issues surface. A region might be technically healthy but slower from certain network paths. Another might show minor instability during scaling that internal monitoring misses.
You stop measuring server health and start measuring experience health.
Validate deployments with telemetry, not instinct
One of the biggest operational shifts happens during deployments.
Instead of asking “did anyone complain?”, you open Application Insights.
Deploy into EU only. Watch request duration. Watch failure rate. Watch instance count. Compare with US, which is still serving traffic normally.
You see exactly what impact the deployment had, how long warm-up took, and when performance stabilised.
That changes behaviour.
Deployments stop feeling risky and start feeling measurable.
This is where XP starts feeling mature
When you can see regional behaviour clearly, something shifts in how the platform is operated.
You stop guessing which region is under pressure.
You stop assuming failover will work.
You stop relying on user reports to detect instability.
You operate based on telemetry.
And once you have that clarity, you’re ready for the next step.
In the next post, we introduce Azure Front Door as the global control layer. Not to replace what you’ve built, but to intelligently route traffic across it.
That’s where regional delivery becomes true global delivery.
And by that point, you won’t be hoping it works.
You’ll be able to prove it.


Leave a Reply