


In today’s content-driven world, Digital Asset Management (DAM) platforms I feel have become part of the backbone for marketing operations, creative workflows, and omnichannel delivery.
But while a DAM helps organize, approve, and distribute assets, reporting dashboards are what transform that organized chaos into clarity. They offer a lens into what’s working, what needs attention, and where content is driving real business value.

This post explores why reporting dashboards matter, the kind of data they surface, what Sitecore Content Hub offers out-of-the-box, and how you can go further by extending its capabilities with React components.
Why Are Reporting Dashboards Useful in a DAM?
Without dashboards, a DAM while pivotal is just a repository. Reporting dashboards inject intelligence into the system, showing patterns and empowering teams to act based on real data. Here’s why they matter:
- Visibility: Understand what content is being used, reused, or not used at all.
- Governance: Spot expired assets, non-compliant content, or assets missing metadata.
- Optimization: Learn which channels use which assets or formats perform best to inform future production.
- ROI Tracking: Justify spend on asset creation with concrete usage and engagement metrics.
- Operational Efficiency: Detect workflow bottlenecks, approval delays, or process gaps.
Imagine a global marketing team preparing for a product launch. A dashboard showing the number of approved assets per region, along with missing translations, could be a make or break moment.

What Kind of Data Should a DAM Dashboard Show?
A well-designed dashboard should give users both high-level KPIs and the ability to drill down into any part. Here’s a breakdown of valuable metrics:
📈 Asset Usage Trends
- Total downloads/views over a certain time period
- Top-performing assets by channel
- Frequency of reuse across campaigns


🛠️ Lifecycle & Metadata
- Assets nearing expiration
- Missing or incomplete metadata
- Assets waiting on approval or stuck in review
🌐 Channel & Format Insights
- Asset type breakdown (JPEG, MP4, PSD, etc.)
- Usage by output type (web, email, print)
- Engagement by campaign or initiative

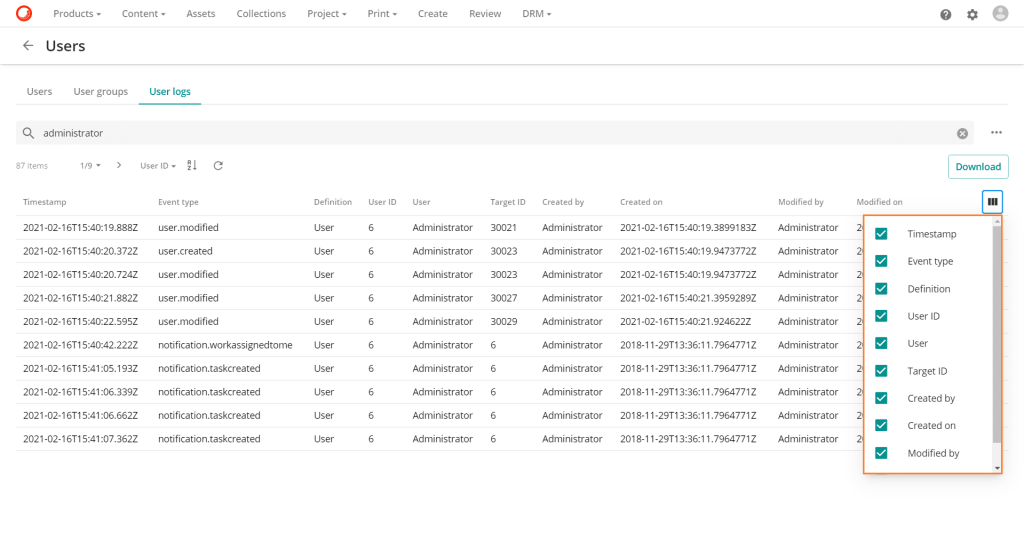
👤 User Behavior
- Most active internal users or partners
- Access logs by location or role
- Average time from upload to publication
📦 Storage & System Health
- Storage consumed by brand or business unit
- Duplicate assets or orphaned content
- CDN delivery stats, if integrated

These metrics help content leaders balance creative output with governance, ensuring brand assets are not just available – but useful.
What Sitecore Content Hub Offers Out-of-the-Box
Sitecore Content Hub is a tool I know extremely well and from this part onwards I will use it as the platform of choice as I know it excels here.

Content Hub provides solid foundations for reporting through built-in dashboards and external integrations:
Built-in Dashboards
- Available on core modules like Assets, Projects, and Campaigns
- Use configurable KPI widgets and saved search widgets
- Role-based dashboards tailored to Marketing Ops, Legal, or Creatives
Power BI Integration
- Export data from the Content Hub API to visualize in Power BI
- Combine with business data (e.g. sales, campaigns) for broader insights
- Create executive-level dashboards to monitor adoption and performance
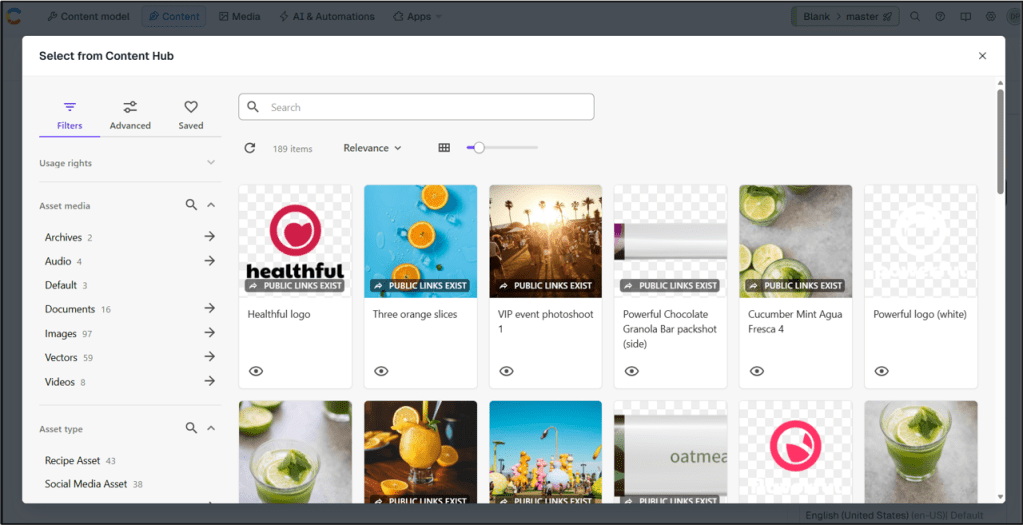
Saved Reports
- Create advanced filters using taxonomy, metadata, or relationships
- Save and share with teams via dashboard widgets or external exports
While the native capabilities are good, Content Hub really shines when extended using custom React components.

How to Extend Dashboards with React Components
Sitecore Content Hub allows developers to create custom components using React. These widgets can be embedded into dashboards or custom pages, fetching data from Content Hub’s APIs and/or third-party sources.
I have written blogs before on the topic and please reach out if you have ideas or need advice.
Here are some ideas and implementation tips:
Custom Dashboard Widget Examples
Heatmap of Asset Downloads by Country
- Use a JS mapping library in a React component. Easily plot data by location then show heatmaps overlayed. All the data is in the Sitecore Content Hub API so it’s simple to query.
Workflow Bottleneck Tracker
- Show number of assets stuck in each stage of the process and group this by custom metrics.
Metadata Completeness Score
- For each asset, calculate % of required fields completed based on your own requirements. Then easily visualise as a trendline or pie chart using a charting module like ChartJS.
Real World Use Cases
Use Case 1: Global Brand Manager
Problem: Needs to understand which campaign assets are live, approved, and used across regions.
Possible Solution:
- Assets Approved by Region
- Missing Translations for content items
- Top Downloaded Assets per Region
Outcome: Enables better localization planning and identifies underutilized assets.
Use Case 2: Legal & Compliance Officer
Problem: Must ensure no expired or unapproved assets are used externally.
Possible Solution:
- Expired asset alert list
- Approval stage tracker
- Metadata completeness checker
Outcome: Avoids compliance risks and supports regular audits.
Use Case 3: Creative Operations Lead
Problem: Wants to streamline creative workflow and identify bottlenecks.
Possible Solution:
- Assets in Review > 7 Days
- Average Time to Approval
- Assets by Workflow Stage
Outcome: Reduces delays and ensures timely delivery of campaign assets.
Conclusion
Reporting dashboards are no longer a nice-to-have in a DAM – they should be one of the most important items on the list.
Whether you’re overseeing creative production, managing compliance, or proving the value of digital assets, dashboards. Sitecore Content Hub would empower you with real-time, role-specific insights.
And with React, your dashboard isn’t limited to static charts – you can craft dynamic, interactive, and visually rich experiences that fit your exact needs.
I have not explored it here but also AI could easily be integrated into platforms to suggest automatically based on the data. This will be saved for a future post.
Please reach out if you want to find out more about how this topic could benefit you.


Leave a Reply